|
|
||||||||||||||||||||||||||
|
Filtration of feedwater in power stations
|
||||||||||||||||||||||||||
|
The filtration of feedwater is extremely important in the technology process of power stations. At the critical points of the water-steam cycle the iron and iron oxide pollutions get into the system. These pollutions may cause malfunctions in other points of the process, mainly in valves, nozzles and devices. The failures may prevent or undermine the continuous operation of a power station block. During the cleaning of the filter the system must be switched over to other mode or even stopped in worst cases. None of them is a preferred event. Should it happen that the free surface of the filter and its capacity do not comply with the concentration of pollution or the filter grade size does not comply with the polluting particle size distribution, the unwanted event may occur.
Further the selection of a concrete filter; its applied method as well as the operational experience will be presented.
1.,
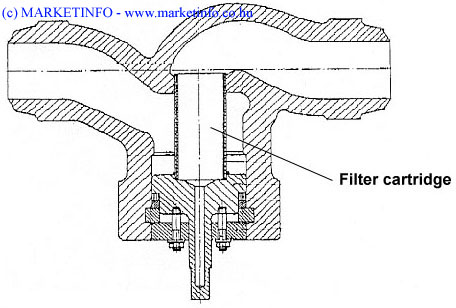
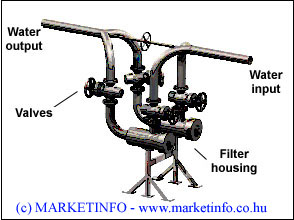
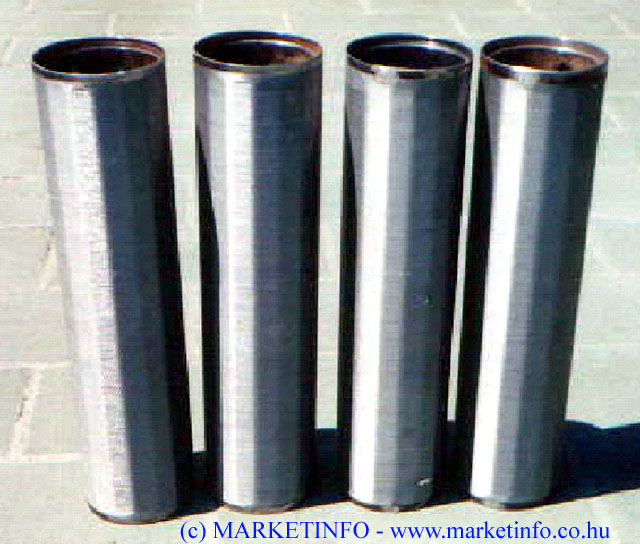
Input data Figure 1. The original filter. (D50 x 100 mm)
Figure 1.
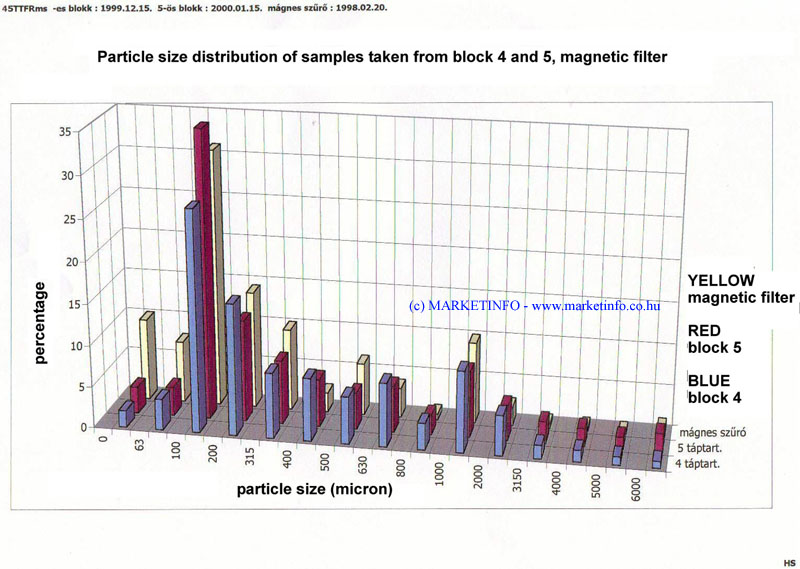
2., Laboratory tests On the basis of the samples taken from the feedwater the polluting materials, their chemical analysis, particle sizes, concentrations and quantity of the characteristic fractions were determined. The samples were taken from the feedwater reservoirs and after the magnetic filter. The results are showed in Figure 2.
Figure 2.
From the diagram it can be
concluded that the particle sizes are above 100 μm in all three cases
(almost 90% of them). Only the magnetic filter samples are worse, the 17%
of particles are below 100 μm.
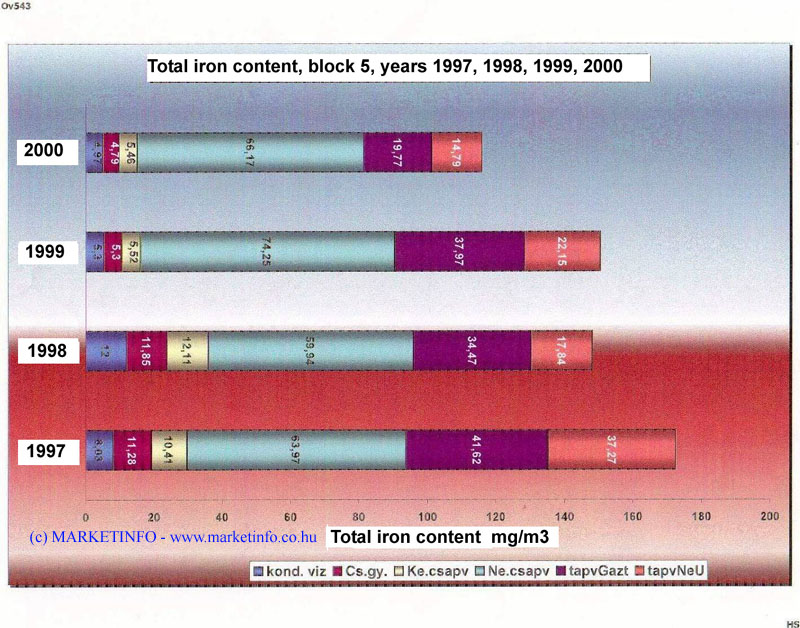
Figure 3. The vertical axis is the years, the horizontal one is the total iron content. Different colours illustrate the iron content of waters flowing into the feedwater. The diagram shows that the concentration of pollution varies. In spite of it the minimum and maximum concentrations can be well estimated. In all probability the concentration falls between 100 and 200 mg/m3.
3., Fixing the filter
objective
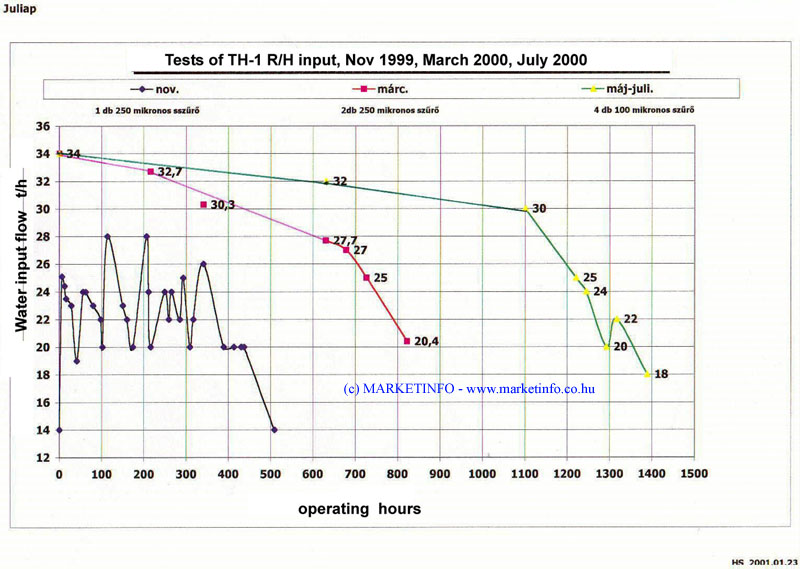
Figure 4. The horizontal axis is the number of operating hours, the vertical one is the water flow that passed through the filter. The black line is for the original, small free surface 205 μm filter, which required 50-hour service cycle. The red line is for 2 Ecofilt Mikrofilters with 250 μm filter grade size and much larger free surface. This equipment worked 750 hours. The third green line is for 100 μm filters, selected on the basis of laboratory results. Four filters worked 1250 hours in parallel connection. Evaluation of test results made possible to fix the filter objective. The 100 μm filter grade size is suitable, because it is not harmful for the equipment to be protected. On the other hand, the free surface of the filter must be 1000 times larger than that of the original in order to ensure the long service cycle. Now the filter objective is to install a battery of 100 μm filters with quarterly service cycle.
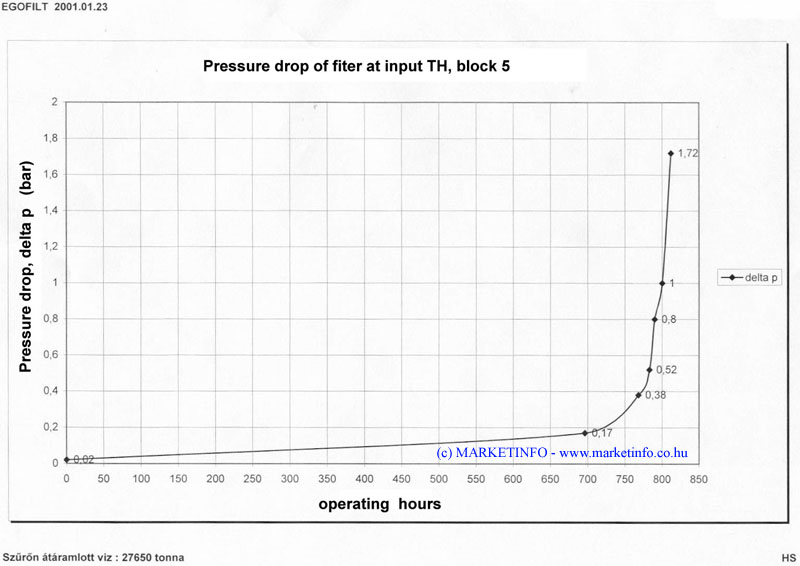
4., Implementation Figure 5. Figure 6. The first filter was started just after the installation. For continuous monitoring of clogging a ∆p transmitter was also mounted. Figure 7 shows a diagram of pressure drop versus time. The horizontal axis is the operating time, the vertical one is the pressure drop.
Figure 7. As it can be seen the starting pressure drop of filter is 20 millibar, during the operation the pressure drop increased up to the 1.72 bar, at that level the filter was stopped. This value was reached after 812 hours of operation and filtering 27650 tons of feedwater.
5., Installation and its
results
The first filter has been working since 1999, it works together with the others installed later even today. Acknowledgement: I would like to express my acknowledgements to the management and workers of the power station for the opportunity of tests and this project as well as for the correct co-operation. |
||||||||||||||||||||||||||
|
||||||||||||||||||||||||||